Data Smart : Summary

Data Science is a very loose word and can mean different things in different situations. However one thing is certain, the principles used in tacking problems are from diverse fields. Drew Conway has this Venn diagram on his blog :

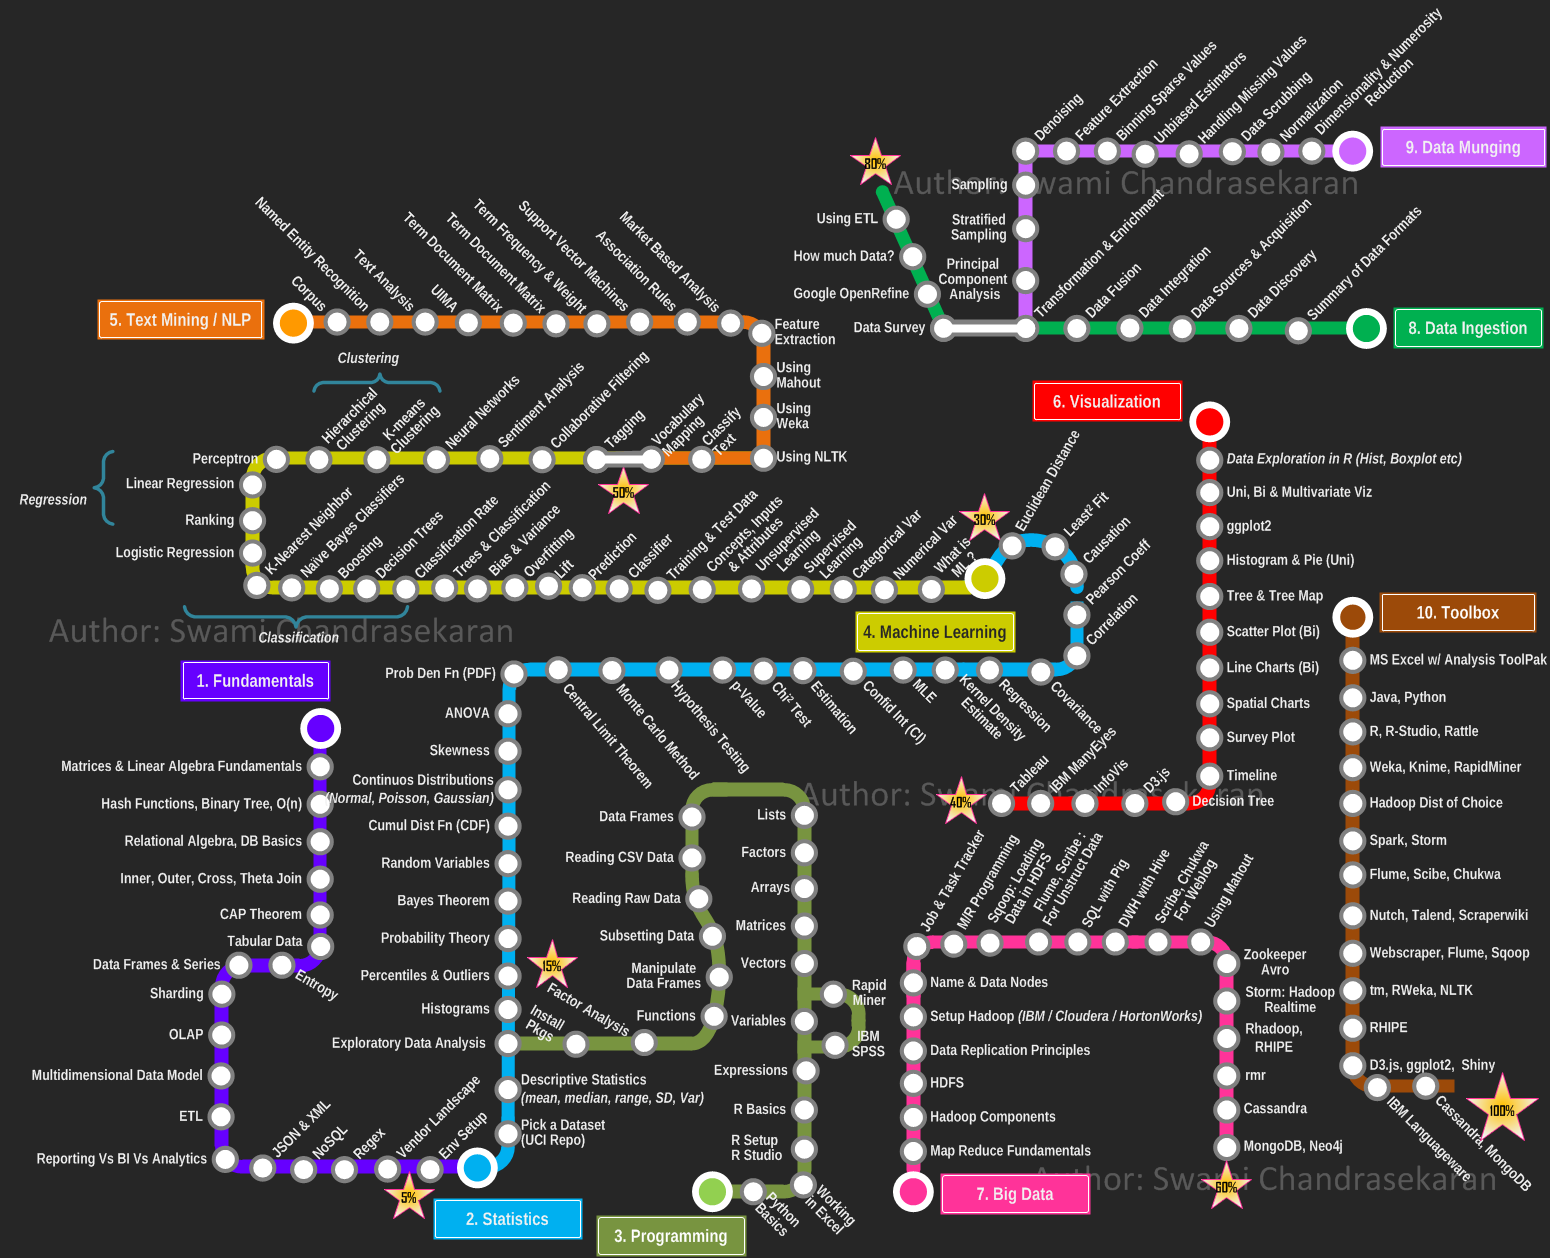
In such a diverse field one does not know where to start and how to start. Someone has made a nice Metromap too. All said and done, this is a field that has considerable entry barriers. One needs to spend at least a few years to get the basics right to understand some basic algorithms.
Where does this book fit in? This book is apt for people who want to see what’s going on behind various algorithms without the math. The book touches upon a dozen topics in data mining and explains the main principles of each of those topics via Excel. By restricting to Excel, the author enables a wider audience to get a glimpse of the various concepts. The ideal way to to read this book is by working out the various case studies that are mentioned in the book. I could not motivate myself to do the analysis in Excel, so replicated the analysis in R. In this document I have listed down some of the code to work through the book, that essentially replicates the results of the analysis done via Excel. But first a brief summary of the chapters in the book.
Chapter 1 is on Excel and can be speed read as I cannot imagine someone reading this book without ever working on Excel. Chapter 2 discusses k-means clustering. It uses an offer-purchases dataset to segment the customers in to various clusters for better marketing. The k-means needs a distance metric and there are many to choose from based on the situation. The book shows that for the specific dataset used, correlation based distance or cosine similarity score is a better metric than Euclidean distance.
Chapter 3 is on Naive Bayes, a simple method that surprisingly performs better than many other algorithms. In fact the reason for its ubiquity stems from its simplicity; it does not overfit the data.Naive Bayes principle is applied on a set of tweets to classify them as business-related or junk. Obviously there is not much of math in this book as expected. So, the results from this chapter will motivate anyone to understand the reason why Naive Bayes works and understand why bias-variance tradeoff works very differently in a classification setting than a regression setting.
Chapter 4 is about optimization, the quintessential skillset that any data scientist needs to have. Using a case study, the author introduces Linear Programming, Integer programming, Mixed Integer programming and ways to convert a nonlinear optimization problem in to Linear Optimization problem. The good thing about this book and this chapter in particular is that there is a good sense of humor that the author brings along while explaining principles. That makes the book an immensely readable book.
Chapter 5 discusses graph analysis and uses the same dataset from one of the previous chapters to do an unsupervised learning. k-neighborhood and Modularity maximization procedures are used to group the customers in to communities. Even though Gephi is used for Visualization, igraph is powerful enough to give all the visualization features to an R user. Chapter 6 is about regression. The book uses a sample dataset to explain the concepts of regression and logistic regression.All the creation of dummy variables, setting up the objective function etc. are done in Excel and the reader is made to understand the basic steps behind regression modeling.
Chapter 7 gives the reader an insight in to wisdom of crowds type models. The models discussed are Random Forest and Boosting. A reader who reaches until this point of the book is abundantly convinced that Excel is too painful use boosting techniques, where every model built on a bootstrapped sample has to be recorded as a macro and one has to run it manually to get estimates. In any case, the chapter does a wonderful job of explaining the nuts and bolts of Boosting.
Chapter 8 gives a crash course on exponential smoothing. It starts off with simple exponential smoothing and then moves on to Holt’s trend-corrected exponential smoothing and finally ending with multiplicative Holt-Winters exponential smoothing. The basic limitation of these models is that there is no probabilistic framework around them. Hyndman has written a book on Exponential smoothing where he casts all the models in a State space framework that makes the models far more richer.
Chapter 9 talks about outlier detection and introduces three methods: indegree method, k-distance method , local outlier factor method. Chapter 10 introduces some basic commands in R and then works out the k-means model, the regression model, the random forests model, forecasting model and outlier detection methods in R. Chapter 11 is the concluding chapter in the book that talks about some soft skills that a data scientist should have in order to be effective in an organization.